API Gateway - Setup Logging
本文延續 Overview API Gateway 相關筆記,整理在 Amazon API Gateway 中, 如何使用 CloudWatch Logs (以下縮寫 CWL) 找問題、Debugging,設定包含以下:
- Enable CloudWatch Logs for API Gateway
- Enable API Logging for Stage
- Custom Access Logging
Enable CloudWatch Logs for API Gateway
API Gateway 本身寫入 Log 需要一個 IAM Role,這個 Role 要有寫入 CWL 的權限。
AWS 的 Service 跟 Service 之間要溝通,或者呼叫 API,也是要有權限的。可以想像是 EC2 Role 那樣的概念,API Gateway 要有指定 Role 之後,才能有權限對 CloudWatch 操作。
到 IAM ,建立一個 Role,建立的時候 AWS Service 選擇 API Gateway,use case 選擇 Allows API Gateway to push logs to CloudWatch Logs.,如下圖:
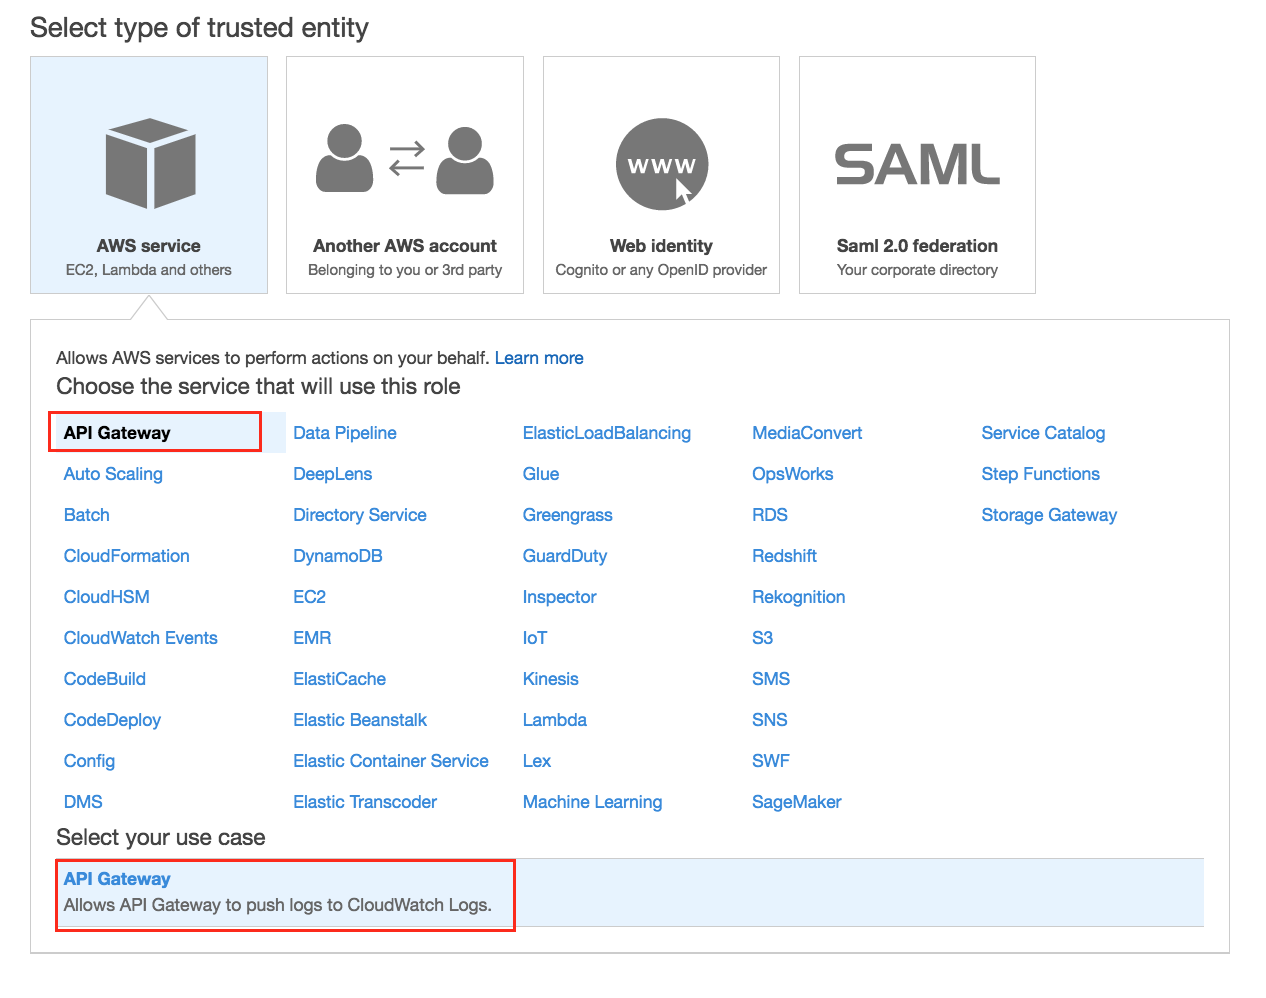
然後命名 Role Name 建立即可,確認以下:
- Role 裡面會有這個 Policy:
AmazonAPIGatewayPushToCloudWatchLogs - Trust Relationship 會有
apigateway.amazonaws.com
複製 Role ARN,長得大概像這樣:arn:aws:iam::123456778:role/APIGateway-CWL-Role
回到 API Gateway,左下方的 Settings,把 Role ARN 貼上去儲存後即可。
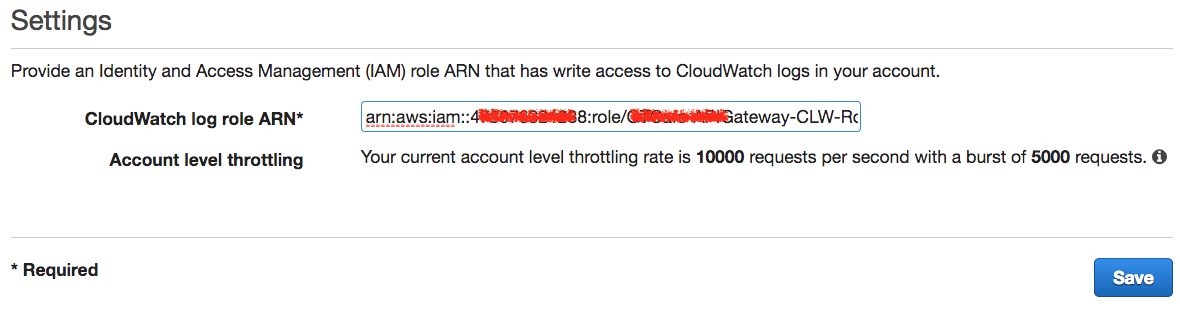
到這裡,完成了 API Gateway Log 的權限設定。
Enable API Logging
到任意已經 Deploy 的 API Stage,找到 Logging Tab,到 CloudWatch Settings -> Enable CloudWatch Logs,如下圖:
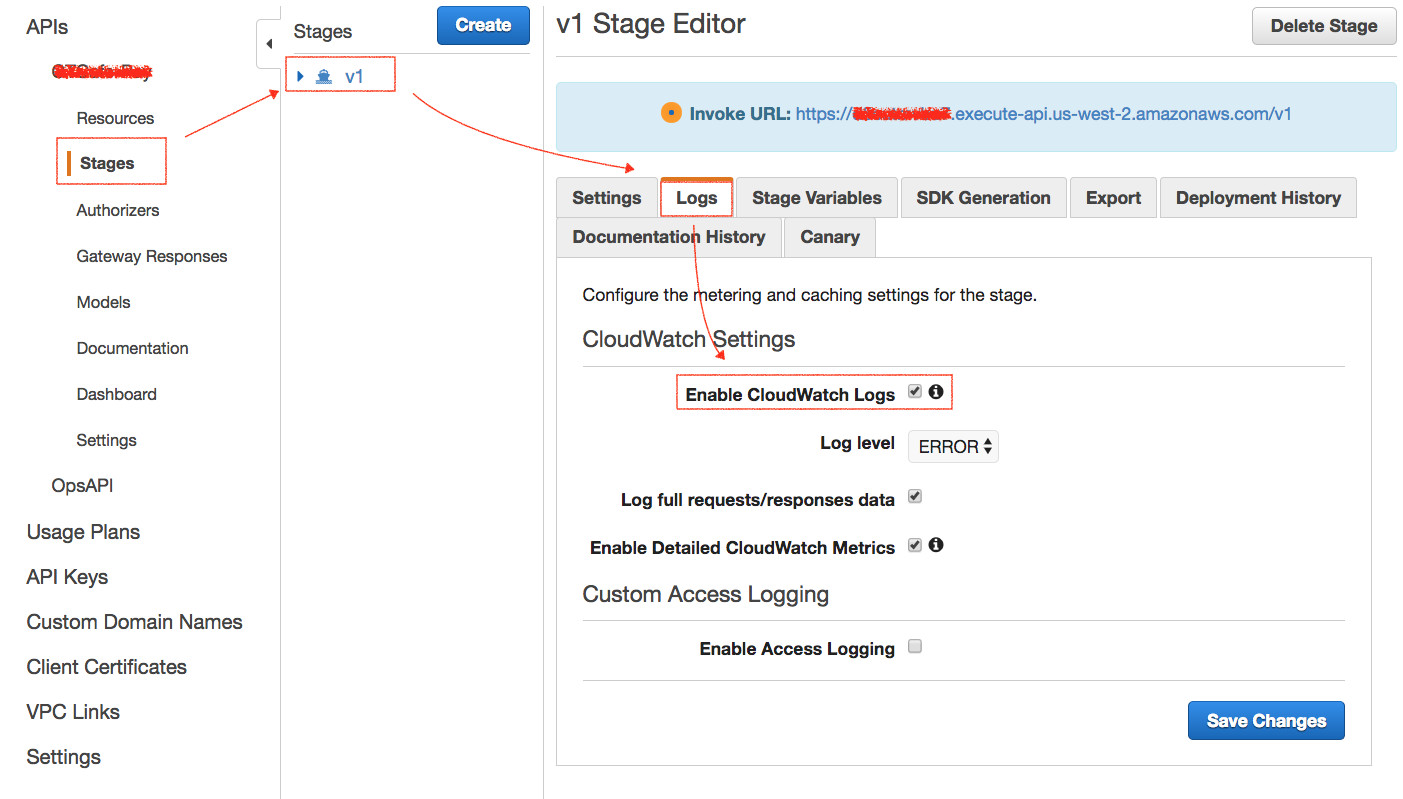
順利 Enable 之後,嘗試送一些 Request 後,到 CWL 會找到像這樣的 Log Group Name: API-Gateway-Execution-Logs_{API_ID}/{Stage}。點進去之後會發現有很多 Log Stream,我猜測是各個 CloudFront Egde 收回來的。
打開 Last Ingestion Time 欄位,可以找到最近搜集的資料節點,點進去就可以看到 Log 了。
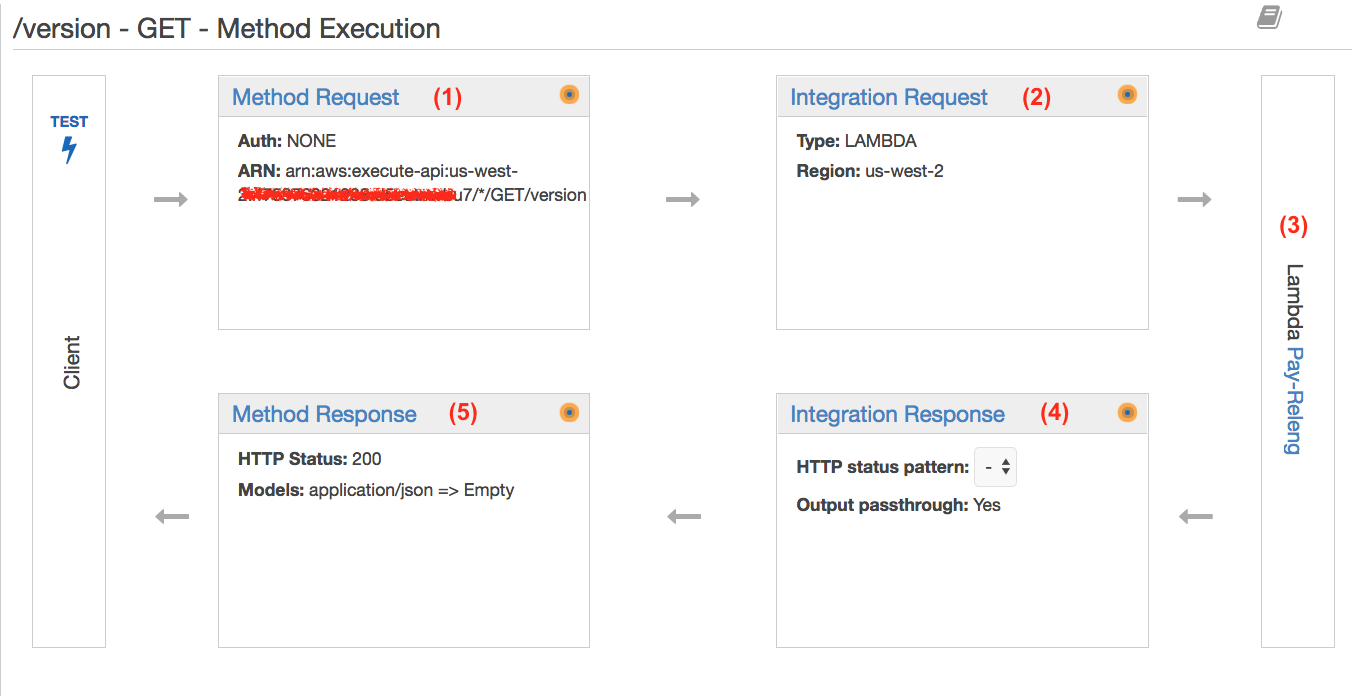
這裡面記錄每個 Request 到 Handler (Lambda),然後回去 (Response) 的資訊,這個流程如下圖:
這些過程的 Log,對應到 CloudWatch Logs 顯示如下:
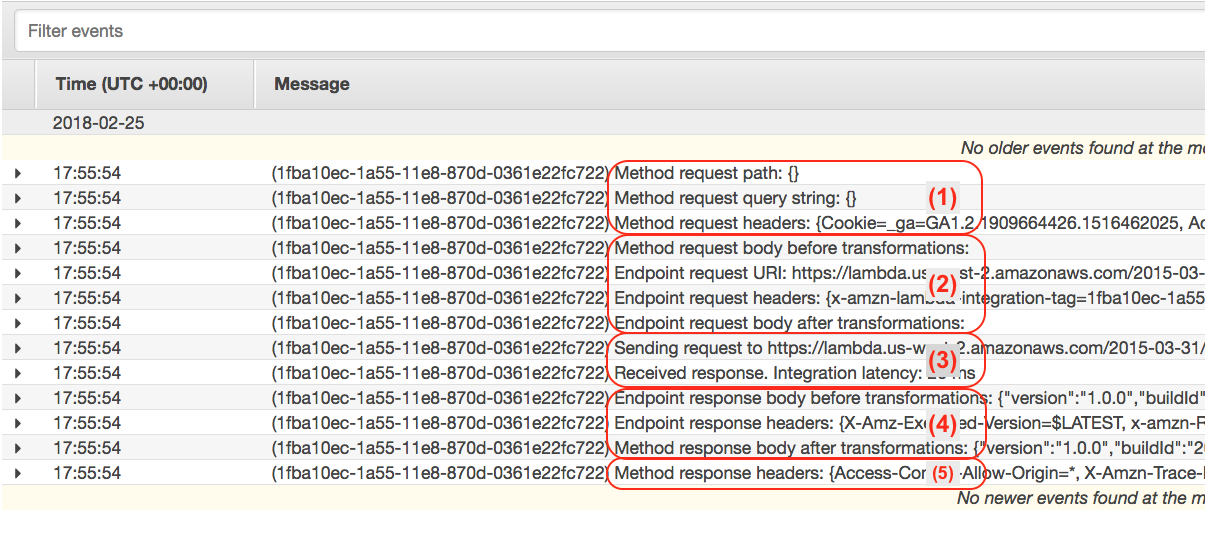
從 Log 可以知道這些資訊:
Method Request: 收到的 Request 的相關資訊,像是 Query String、HeaderIntegration Request: 經過 Integration Request 轉換前後的資料,送給 Endpoint 的 HeaderHandler: 實際上處理的 Endpoint 在哪裡,如果是 Lambda,則會顯示使用哪一個版本、處理多久
- 如果是 Lambda,另外還有 Lambda 自己的 Log 可以看。
Integration Response: Handler 處理完後,回給 API Gateway 的資料是什麼,透過 Integration Response 轉換前後的資料Method Response: 最後回傳 Response 的 Header
如果覺得預設這樣的資訊還不夠,需要更詳細的,那麼可以打開 Custom Access Logging。
Custom Access Logging
在 Stage -> Logging 中打開 Custom Access Logging 則可以客製化 Log 格式與相關細節:
CloudWatch Group: 填入 ARN- 格式:
arn:aws:logs:{AWS_REGION}:{AWS_ACCOUNT_ID}:log-group:{LOG_GROUP_NAME} - 例如:
arn:aws:logs:us-west-2:1234567980:log-group:/API-Gateway/Loggin/v1 - 此 Log Group 不需要預先到 CloudWatch Logs 建立
- 格式:
Log Format: 底下是我的例子,但是要注意長度是有限制的。底下方便顯示而已。Log 裡有哪些變數可以使用,請參考 API Gateway Mapping Template Reference
1 | { |
CloudWatch Metrics
Stage -> Logging -> 打開 Enable Detailed CloudWatch Metrics,則可以看到更多更細的 Metrics:
- By Method
- By Stage
- By API Name
其中最有用的就是 Method,可以知道使用率,太低的就可以想辦法改進,或者 sunset.
不足
API Keys 的 Usage Log (Biz Requirement) 沒有找到詳細地使用資訊,如果需要知道每個 API Keys 的使用狀況,就要另外自己做。現在想到的方法就是透過 CWL 客製化 Metrics.
結論
API Gateway 的 Log 可以分成幾個部分:
- API 本身的流程的 Log,用來確認 API Gateway 設定是否正常。CloudWatch Log Group Naming:
API-Gateway-Execution-Logs_{API_ID}/{Stage} - Handler (Lambda) 自身的 Log,Debug / Trace Handler 自身的邏輯與資訊
- 客製化 Log:額外增加的,同樣是 Debug / Trace API Gateway 的
開發過程當中,很需要知道整個串接的過程到底發生什麼事情, Log 最完整的,所以知道怎麼配置很重要。
寫到一半還 地震,規模 5.2 …
延伸閱讀
系列文章
- Study Notes - Overview API Gateway
- Study Notes - Amazon API Gateway
- API Gateway - Custom Authorizers using Lambda
- API Gateway - Setup Logging
- API Gateway - Custom Domain Names
- API Gateway - Integrate with Internal Services
- Using API Gateway as DynamoDB Proxy
- API Gateway - Rate Limit and Throttling
- API Gateway Private Endpoint
- Design Async Invocation using API Gateway and SQS
- 2018/06/28: AWS Summit - 邁向 API 經濟 - API Gateway 導入之旅
站內延伸
參考資料
Comments
About
著作
演講
- 演講錄影 @ Youtube
- 探索職涯、複利人生 - AWS Career Exploration Day 2023
- 個人著作 SRE 書友見面會
- 軟體測試實務 - 新書發表會
- 探索職涯、成就未來 - AWS Career Exploration Day 2022
- 從理想、到現實的距離,開啟品味軟體測試之路
- 91APP 在 AWS 上的 SRE 實踐之路
- 在矩陣型組織裡,如何有效管理 AWS 的成本結構與系統架構
- 災難演練 @ AWS 實戰分享
- 導讀持續交付 2.0 - 談當代軟體交付之虛實融合
- 聊聊軟體交付的濫觴 談產出物管理
- 從緊急事件 談 SRE 應變能力的培養
- 邁向 API 經濟 - API Gateway 導入之旅
- Monitoring Tools 大亂鬥 - AWS CloudWatch
- Ops as Code using Serverless
- 淺談系統監控與 CloudWatch 的應用
AWS Certifications